Okay, picture this: someone grabs their phone or laptop and actually types your brand name into Google. That, my friend, is where Share of Search (SoS) comes strutting in like it owns the place. SoS is basically the slice of the total search pie your brand is claiming in your market or category. Fancy formula moment: take your branded searches, divide by all branded searches in your category, multiply by 100, and boom—you’ve got your SoS. For example, 20,000 searches for your brand while all competitors combined hit 50,000? Congratulations, your SoS is 40%. Not too shabby, right?
Here’s where it gets juicy. SoS isn’t just a number. It’s a neon sign flashing “People actually want us!” Unlike clicks, impressions, or those metrics that sometimes feel like counting clouds, SoS measures pure consumer intent. When someone types your brand, they’re past casual curiosity—they’re actively thinking about buying, comparing, or engaging. It’s like catching a consumer in the act of thinking, “Yeah… I want this brand.” SoS doesn’t just show awareness; it shows engagement in motion. It’s your brand’s moment in the spotlight, reflecting how well your past marketing, product magic, and clever messaging are translating into real-world interest.
Looking to amplify your brand’s visibility and get more people searching for you? PRNEWS.IO helps you distribute press releases that boost awareness and drive search interest—directly impacting your Share of Search.
How we graduated from media metrics to real demand signals
So why are marketers suddenly obsessed with SoS? Part of it is because the old guard—hello, Share of Voice (SoV)—has started to feel like a relic from another century. Back in the day, SoV was king, tracking your share of all advertising spend in your category. But in today’s dizzying mix of digital, social, video, podcasts, billboards, and whatever else is trending, tracking every cent spent across channels is basically trying to herd cats while juggling flaming swords. Not exactly reliable, and definitely not fun.
Enter SoS, stage left. It’s powered by search engine data—constant, easy to access, and way less wallet-draining than expensive surveys or focus groups. Tools like Google Trends or SEO platforms make it simple for even the scrappiest team to monitor SoS. No more waiting for a quarterly snapshot that may already be obsolete. Instead, you get near-real-time signals of how consumers are thinking, searching, and vibing with your brand.
The speed advantage here is massive. Traditional methods are like checking the weather from last week. SoS? It’s your personal weather app that tells you it’s about to pour on your competitor’s parade—or shine a spotlight on your next growth opportunity. You can spot trends, pivot strategies, and protect your turf before the lagging sales reports even blink at you. In fast-moving digital-first markets, this agility isn’t just nice—it’s survival.
Think of SoS as a secret weapon: it measures the momentum of your brand. Every previous campaign, every product tweak, every clever post—all of it comes together to create a digital footprint that shows up as searches. And unlike traditional awareness metrics that might only hint at interest, SoS catches the consumer in mid-decision, giving marketers a crystal-clear early look at potential market share and demand.
In short, SoS lets you see the story behind the numbers. It’s not just a metric—it’s a pulse check, a compass, and a megaphone all rolled into one. It tells you who’s top-of-mind, who’s catching attention, and who might be about to leave you in the dust. And all of this comes without needing a time machine or a crystal ball—just a smart look at what people are typing.

Share of search vs. share of voice: two ways to look cool in the market
Before we get too hyped about Share of Search (SoS), let’s put it side by side with its older cousins, Share of Voice (SoV) and Organic Share of Voice. Think of it like meeting the in-laws: knowing who does what keeps everyone from stepping on each other’s toes.
Classical SoV: paid ads, media noise, and why it’s not enough
SoV is basically the metric that tells you how loud your brand is yelling compared to the other kids on the playground. It tracks your share of paid-media exposure—how much advertising money you’re throwing around versus the competition. Fancy, right? It’s great for knowing where you stand in the visibility Olympics, but here’s the kicker: loud doesn’t always mean loved.
Then there’s Organic Share of Voice, which is like SoV’s quieter cousin. Instead of tracking ad spend, it counts how often your site wins traffic for non-branded keywords like “best running shoes.” It’s all about SEO authority and showing that Google thinks you’re cool, but it doesn’t exactly prove that consumers are searching specifically for you.
The problem with classical SoV? It’s all noise and flash, not necessarily action. You can spend a fortune, run the flashiest campaigns, and still not get people actually thinking about—or searching for—your brand.
The intent gap: push vs. pull
Here’s where it gets fun. SoV is all about push: you shout, you get seen. SoS? That’s pull: consumers are coming to you. When someone types your brand name into a search engine, it’s a big neon sign that says, “I want this brand!” It’s proof that all those SoV efforts—ads, billboards, sponsored posts—actually worked and converted awareness into genuine consideration.
And this is key: having a mountain of ad impressions means zip if it doesn’t spark real curiosity. SoS is like a litmus test: if your SoV spikes but SoS doesn’t budge, your creative or targeting probably missed the mark. Basically, SoS separates the brands that are just loud from the ones people actually want.
Marrying SoS and SoV for maximum impact
Smart marketers know it’s not an either-or situation. SoV still matters—it’s the long game, building equity, and staking your claim in brand-heavy categories. But SoS? That’s the quick, tactical weapon, perfect for spotting early market shifts and fine-tuning campaigns.
The magic happens when you combine the two. Use SoV to guide where your ads go (reach, reach, reach!), and let SoS tell you whether people actually care enough to search for you. SEO, content, digital strategy—all of that gets turbocharged when you’re not just shouting into the void.
Here’s the cheat sheet:
| Aspect | Share of Search (SoS) | Share of Voice (SoV) |
| Primary Focus | Consumer intent and demand (they’re coming to you!) | Brand visibility, reach, and media spend (you’re shouting at them) |
| Measurement Input | Branded search volume (organic, real behavior) | Media spend, impressions, ad reach |
| Predictive Value | Strong leading indicator of future market share | Strong indicator of current brand presence |
| Data Source | Google Trends, SEO tools, search engine magic | Traditional media monitoring, ad spend aggregation |
| Cost & Effort | Low cost, high reliability, easy tracking | High cost, complicated data wrangling |
| Best Use Case | Demand forecasting, SEO optimization, digital strategy | Long-term brand building, ad evaluation |
So, in short: SoV gets you noticed, but SoS gets you wanted. Combine them, and you’ve got the perfect recipe for marketing success: loud enough to be seen, compelling enough to be searched, and smart enough to stay ahead.
Quantification and precision: how we actually crunch SoS numbers
The magic formula and what you need to count
Let’s get nerdy for a minute, but in a fun way. Share of Search isn’t some vague “eyeball it and hope” metric—it has a formula, and yes, it’s basically your brand’s search glory in percentages:
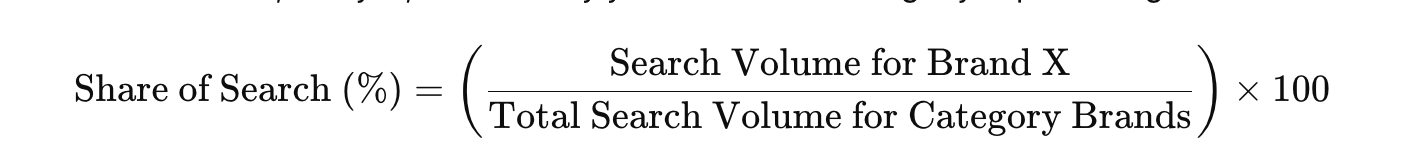
Simple enough, right? But here’s where most folks mess up: it’s not just your brand name slapped into Google. To get a truly heroic SoS, you need the full bouquet of searches—branded keywords, product-specific queries, combinations like “Brand X sedan,” common typos (because yes, people are human), and even the long-tail searches where consumers are creeping around the edges of your brand. Every search counts.
And don’t stop at volume alone. Track Impression Share—how often your brand pops up in search results—and Click Share, which tells you who’s actually clicking. Clicks are the digital equivalent of someone waving and saying, “I want what you’ve got!” That’s where engagement truly comes alive.
Picking your competition: the fine art of defining the set
Here’s the tricky part: the denominator matters as much as the numerator. Your SoS is only as good as the competitive set you define. One size does not fit all, especially if you’re comparing mega-corporations that sell everything from phones to refrigerators. Don’t let irrelevant products inflate your totals and make your brand look worse than it is. For instance, if we’re sizing up “Apple” vs. “Samsung,” focusing on mobile handsets only keeps the metric honest.
Segmentation is your friend. Geographical slices? Vital. A brand might be crushing it in one city but invisible in another. Align marketing spend and inventory to the hotspots where people are actually searching for you. It’s like having a treasure map: focus on the X’s that actually matter.
Tools of the trade: where the data lives
Now, how do you get this magical info? Glad you asked. Here’s your toolkit:
- Google Trends: Cheap, fast, and surprisingly powerful. Compare up to five brands, segment by location and time, and spot trends visually. Limitation? It’s relative, not absolute—think of it as a radar screen for “who’s hot right now” rather than a ledger of exact numbers.
- SEO Platforms (SEMrush, Ahrefs): Your go-to for precise, absolute monthly search volumes. Input your brand, your competitors, and voilà—you’ve got the numbers you need for a true SoS calculation.
- Google Keyword Planner: Usually the PPC sidekick, but great for rounding out your search volume data. Export it, combine it with other sources, and you’re ready to crunch the final SoS percentage.
- PRNEWS.IO – an easy way to publish and distribute press releases globally. By getting your news in front of more audiences, you can increase brand recognition and naturally influence your Share of Search.
When done right, this process gives you a rock-solid baseline for forecasting, strategy, and bragging rights. For example, check out how a hypothetical category shakes out:
| Brand | Average Monthly Branded Search Volume | Total Category Search Volume | Share of Search (%) |
| Brand A (Focus Brand) | 120,000 | 335,000 | 35.82% |
| Brand B | 90,000 | 335,000 | 26.87% |
| Brand C | 50,000 | 335,000 | 14.93% |
| Brand D | 75,000 | 335,000 | 22.39% |
| Total Category Volume | 335,000 | N/A | 100.00% |
Boom. That’s your category snapshot, and each number is a story about who’s getting noticed, who’s actually being clicked, and who’s lurking in the shadows. SoS isn’t just a metric—it’s your brand’s search personality, quantified and ready to guide every strategic move.
The predictive power of SoS: why your brand’s search numbers are basically a crystal ball
Let’s get straight to the point: Share of Search isn’t just a shiny metric to make your marketing team feel smart—it’s a legit predictor of future market success. Big brain alert: advertising wizard Les Binet proved that SoS and market share are basically best friends. When your SoS climbs, your market share usually follows suit. When it dips… well, consider it the polite way of Google saying, “Heads up, you might be losing ground.”
Crunching the numbers, studies show an average correlation of 83% between SoS and actual market share across countries and categories. That’s not coincidence; that’s SoS flexing its predictive muscles. Basically, it transforms your data from marketing fluff into strategic ammo, letting you forecast and allocate resources with real confidence.
Timing is everything: the time lag advantage
Here’s where it gets even cooler. SoS doesn’t just tell you what’s happening now—it whispers about what’s coming. Changes in search behavior often lead market share shifts by 3 to 12 months, depending on how long it takes consumers to pull the trigger.
Take cars, for example. If searches for a top brand drop by 10% this month, chances are market share will follow that same downward trend over the next year. That’s a full year to adjust strategies, tweak campaigns, or get creative before the competition notices.
SoS is also your in-flight campaign copilot. Every ad, every TV spot, every cheeky social post creates ripples in search behavior. Measuring those spikes in SoS tells you instantly whether your creative actually moved people from “meh, I’ve heard of it” to “oh yes, I need this.” And if it doesn’t? That’s your cue to pivot mid-campaign instead of crying over wasted media dollars afterward.
Proof in the pudding: case studies across industries
This isn’t just theory. SoS has been flexing its predictive power across all kinds of industries. In France, the top-selling cars lined up almost perfectly with their share of searches. Not too shabby for a metric that lives in the search bar instead of the showroom.
And it doesn’t stop at cars. Insurance, consumer goods, restaurants, mobile phones, energy—you name it. Across these markets, a brand with a high SoS relative to its current market share is basically waving a flag that says, “Growth coming your way, just watch.”
Bottom line: SoS lets you see around corners. It shows where demand is heating up, gives early warning when things cool off, and validates whether your campaigns are actually turning heads. Loud ads might get eyeballs, but SoS gets the clicks—and those clicks are the start of real consumer action. In other words, SoS isn’t just a number—it’s your brand’s GPS to future market victories.

Operational challenges and nuances in SoS: the real-world stuff you need to know
Share of Search is powerful—like a Swiss Army knife for marketers—but wield it without knowing the quirks, and it can bite back. Let’s unpack the bumps in the road and how to navigate them like a pro.
When volume isn’t the whole story
Here’s the thing: SoS tells you how much people are searching, but not why. A spike in searches could be a happy dance over a new product launch—or a collective freakout because of a recall, a PR nightmare, or that viral meme you never wanted. Raw numbers alone won’t tell you if the signal is sunshine or storm clouds. The fix? Layer in some qualitative data—sentiment analysis, news monitoring, social chatter—so you know whether the interest is “yay” or “uh-oh.”
Then there’s the tech side of things. Tools like Google Trends are amazing for spotting patterns, but they give relative indexes, not precise volumes. And let’s not forget the direct-traffic rebels—loyal fans who bypass search engines and go straight to your site. If you ignore them, your SoS can look sadder than it really is.
The small brand conundrum and category headaches
Small brands, niche players, and quirky startups—you’re awesome, but SoS can be tricky for you. Low search volumes make numbers wobbly, and generic or easily misspelled names add a “clean data nightmare” flavor.
The bigger headache? Defining the competitive set. If your market is broad, evolving, or a bit like the Wild West, deciding who counts in the denominator can get messy. The answer: get granular. Track sub-categories, product types, or hyper-local competitors instead of lumping everything together. Focused, specific SoS = actionable insights; aggregated totals = confusing noise.
Branded vs. non-branded: two metrics you need to juggle
Want the full picture? You’ve got to watch both Branded and Non-Branded SoS. Branded SoS is your core fan club—people searching directly for your brand or products. Non-Branded SoS is your radar for the broader playing field—generic searches like “top accounting software” that show how well your SEO and content marketing are working against competitors.
The ratio between these two is your secret weapon. If both are growing, you’re in marketing harmony. If Branded SoS is booming but Non-Branded is flatlining, it’s a red flag: you’re strong with current fans but missing out on new prospects still in research mode. That’s a cue to boost content and SEO to capture those early-stage searchers before the competition does.
Here’s a quick cheat sheet of common headaches and how to fix them:
| Challenge | What’s Going Wrong | How to Fix It |
| Ambiguous Intent | Volume spikes could be good (purchase intent) or bad (recall, complaints) | Mix in qualitative research and sentiment analysis to figure out the vibe |
| Low Volume Reliability | Small or niche brands don’t always get enough searches for solid stats | Zoom in on regional data or compare only to immediate, local rivals |
| Direct Traffic Bias | Super fans bypass search engines, hiding true demand | Combine SoS with internal direct website traffic metrics |
| Category Scope | Big, complex, or new markets make defining competitors tricky | Use granular, geo-specific, and product/sub-category SoS tracking for real insights |
Bottom line: SoS is amazing, but it’s not magic. Know the quirks, segment smartly, track both branded and non-branded searches, and layer in some sentiment smarts. Do that, and your SoS becomes not just a metric, but a strategic playbook for where to focus your energy, budget, and creativity.
Strategic application: turning SoS into market share mojo
Share of Search isn’t just a metric—it’s your marketing seatbelt and dashboard all in one. It gives you rapid-fire feedback on your campaigns, letting you see what’s working before the sales numbers even show up at the party. Launch a new ad? Watch your branded searches spike. That surge tells you instantly whether your creative and media placement are actually connecting—or if they’re just background noise.
Think of it this way: your strategic goal is to keep your Share of Search higher than your current Market Share. Why? Because that gap is like your brand revving its engines before the race even starts. It signals growing demand that’s almost guaranteed to roll into future market wins. In other words, SoS = marketing foresight, minus the crystal ball.
Digital strategy and resource allocation: smarter moves, less guesswork
SoS isn’t just about seeing the now—it’s your guide for where to focus your digital energy. SEO wizards and content gurus, listen up: tracking competitor SoS shows you when a rival is gaining traction. Maybe they just launched a killer product or nailed a branding moment. Whatever the case, you can respond fast—adjust keywords, tweak content, or unleash your own competitive campaign before anyone notices you were even behind.
And let’s talk budget smartness. SoS data can be visualized with heat maps showing exactly where searches are hottest. That’s your map for aligning ad spend and distribution with areas that actually want your brand. No more throwing money at the void—focus on the hot spots, the untapped pockets, and the regions signaling latent demand. Marketing dollars get stretched further, campaigns hit harder, and your brand is everywhere your customers are actually looking.
Tip: Combine SoS tracking with strategic press distribution. Services like PRNEWS.IO allow you to publish timely press releases that increase visibility, attract searches, and complement your SEO efforts.
Bottom line: SoS isn’t just a metric to admire—it’s a tactical playbook. Use it to validate campaigns in real time, respond to competitors faster than a social media meme goes viral, and make every marketing dollar count. Your brand doesn’t just compete—it leads, anticipates, and grows, all guided by the search signals your audience is leaving behind.
Conclusion: your SoS playbook
Share of Search has officially earned its cape in the marketing superhero hall of fame. It’s not just a number—it’s a crystal-clear signal of what your audience actually wants, predicting future market share like a marketer’s sixth sense. Unlike old-school, media-heavy metrics that tell you what you spent, SoS shows you what people care about, in real time, and without breaking the bank.
Of course, to turn SoS into pure strategic gold, you need a bit of methodological rigor. Nail your competitive set, pick the right tools to get absolute search volumes, and slice the data finely—geography, products, categories—the whole shebang.
Here’s how to make SoS really work for you:
1. Validate and Refine the Denominator: Keep your competitive set fresh. Markets evolve, competitors pivot, and if your SoS denominator is outdated, your insights are about as useful as a chocolate teapot. Regularly check which brands matter and adjust your category definitions so your metric stays sharp.
2. Optimize the Conversion Funnel: SoS tells you people are interested—but clicks turn that interest into action. Make sure your brand pages rank high, have compelling metadata, and convert searchers into engaged visitors. Think of it as turning curiosity into commitment.
3. Harness the SoV Feedback Loop: Treat SoS as your real-time campaign GPS. If your ad spend (SoV) isn’t lifting SoS in a meaningful, lasting way, it’s a red flag to tweak your creative or media strategy. No more throwing money at campaigns that don’t move the needle—adjust while the game is still live.
4. Diagnose Growth Drivers with Segmentation: Track Branded SoS and Non-Branded SoS separately. The first measures your loyal fans’ demand pull; the second shows how you’re performing in the competitive SEO and content arena. Compare them, spot gaps, and decide whether to pump up brand equity or dominate the organic search battlefield.
Bottom line: Share of Search isn’t just a metric—it’s a strategic superpower. When used thoughtfully, it validates campaigns, anticipates market shifts, and guides every dollar and effort toward driving real growth. Follow these recommendations, and your brand won’t just play in the market—it will set the pace

Frequently Asked Questions
What is Share of Search (SoS)?
Share of Search is a metric that measures the proportion of online searches for a specific brand relative to the total searches within a product category or market. It reflects consumer interest and intent and can be used as a leading indicator of brand performance.
Why is SoS important for marketers?
SoS provides an early signal of changes in consumer demand and brand popularity, often predicting market share shifts before they appear in sales data. It helps marketers optimize campaigns, measure brand health, and benchmark against competitors.
How does SoS differ from market share?
Market share measures actual sales or revenue, whereas SoS measures interest and intent via search behavior. A high SoS often precedes higher market share, making it a predictive metric rather than a retrospective one.
Can SoS be used across industries?
Yes. SoS is applicable in consumer goods, technology, services, and other sectors where consumers actively search for brands online. However, it works best in markets with high online research activity.
What factors can influence Share of Search?
- Marketing campaigns and advertising
- Public relations and media coverage
- Seasonal trends or events
- Product launches or recalls
- Changes in consumer behavior or preferences
What are the limitations of Share of Search?
- It only captures online search behavior, excluding offline awareness.
- Data accuracy depends on the tool and market coverage.
- SoS may be influenced by short-term spikes that do not translate to long-term sales.
How can brands improve their Share of Search?
- Invest in search engine optimization (SEO) and paid search advertising
- Increase brand visibility through content marketing and PR
- Engage in campaigns that drive consumer awareness
- Monitor competitors and adjust positioning accordingly
Can SoS predict market share accurately?
While not a perfect predictor, research has shown a strong correlation between SoS and future market share. Trends in SoS can provide actionable insights for brand strategy and forecasting.
What tools are commonly used to track Share of Search?
- Google Trends – provides relative search volume over time
- SEMrush, Ahrefs, Moz – for competitive keyword analysis
- Brandwatch or Talkwalker – for broader brand monitoring
- Custom analytics platforms – integrating search and social data