Often, our expectations do not match reality, especially when a brand invests heavily in advertising and awareness. Those who do not build high expectations will not be disappointed, but those who demand a lot can significantly affect the brand’s reputation. A brand may consider itself number one in the market in terms of quality, but in reality, it lacks high quality and occupies a lower position in the customer’s eyes. To prevent this, it is necessary to invest in advertising from the internal kitchen and sit at the client’s table, who will appreciate your brand’s dishes.
Is it possible to somehow calculate it correctly? Is it possible to monitor the perception of your brand by society? Yes, of course. Perceptual maps will show you the right way to the buyer’s heart and beyond. Let’s delve into this topic completely.
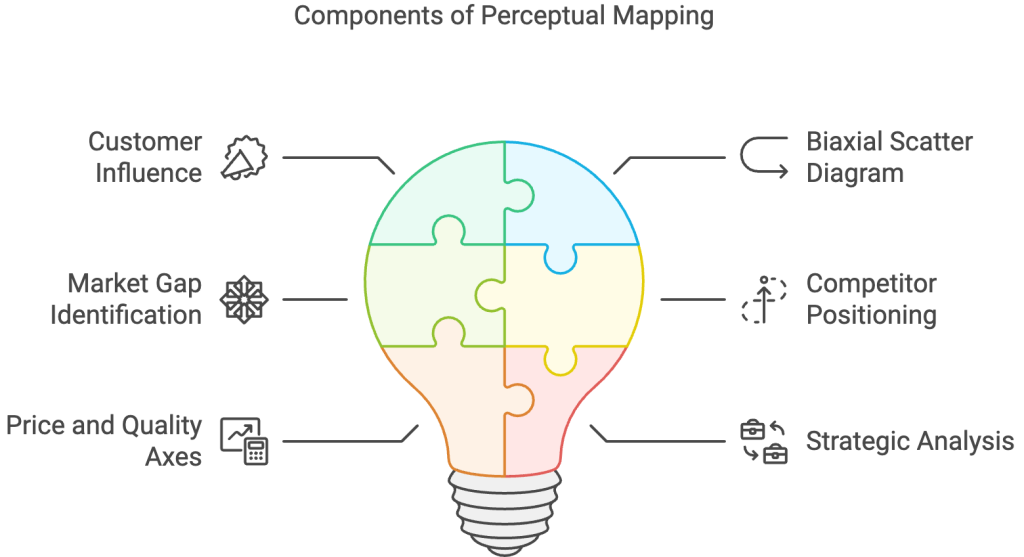
What Is A Perceptual Map?
Perceptual Maps is a method, shown on a diagram or a map, that helps to reproduce the customer’s vision of the brand and to read his moods and preferences. In perceptual mapping, the client has the greatest influence, not the brand. Usually, a company releases a product or a line that works for competitiveness, but this time it is the opposite. The client is here a destructive and all-powerful force, who determines all your pros and cons.
Perceptual maps are depicted on a biaxial scatter diagram but can be multi-dimensional. Even when analyzing only two factors, you can also see the position of your competitors, which is a plus. This can be used to identify market gaps, evaluate your collaborations and partners, and find explanations for failed product launches from the customer’s point of view. If you have difficulty distinguishing your actual position from how you imagine yourself, then perceptual mapping will come in handy.
On two class axes, you have to measure two quantities that are opposite in value. Preferably, the X-axis measures price and the Y-axis measures quality. Why do you need to use different values? Because they will help you reveal the competitors’ cards in your field. The perceptual map should have clear boundaries of where you are, where your competitors are, and where you are in the customers’ eyes. You need to work on the chart as well as any strategy or content plan. Lucky for you, you have us here to reveal the secret ingredient of exactly how to form a perceptual map in this article!
Advantages And Disadvantages
But first, let’s talk about the pros and cons of perceptual maps. You must know some features before you start to form your perceptual maps. If a person is warned, then he is armed, so let’s consider the advantages and disadvantages:
Advantages
- Despite its affinity with mathematics, it is easy to use and to form
- It is easy to learn and develop in just a few steps
- A formation that is independent of anyone, but it can also be done in a team
- Pure information without applications, which contributes to the awareness formation of your position in the market
- Shows your competitors’ influence on you and the market
Disadvanatges
- A diagram can compare quality and price, but not pay attention to social engagement or the atmosphere that reigns in the brand
- The boundaries between what the consumer thinks the company can provide and what the company provides are blurred
- Lies have a crazy effect on statistics and spoil the result
- Difficult Availability of obtaining data for analysis

Kinds Of Perceptual Maps
A classic perceptual map has two variables, but there are also Multi-dimensional Perceptual Maps. These two types depend on and are created under non-identical conditions, so let’s try to distinguish them to understand which of the two types suits you best.
Two-dimensional Perceptual Maps
The most stable and classic option is a two-dimensional perceptual map. A two-dimensional perceptual map uses two defining attributes, such as price and quality, to calculate market defects, competitor positions, and the product’s value for money as perceived by consumers. For example, if the client is looking for a coat for the winter season, then attention will be focused on the ratio of the price and the materials from which the coat is made. The customer will wonder whether it is better to pay more for a brand with good quality or to pay less for questionable quality. Of course, the decision here belongs to the customer, but if the brand tries to make the price commensurate with the quality within the framework of reasonable prices, then the brand will win.
Multi-dimensional Perceptual Maps
Market dynamics can change, and a multidimensional perceptual map should be used for more complex dynamics. A multidimensional perceptual map is used when there is a lack of price-quality comparison to assess brand positioning, and more factors come into play. These factors will already be more detailed and include deeper product information to analyze sales in the customer’s eyes. For example, when choosing a laptop for studying for a student, a student can look not only at the price-quality ratio but also at the internal characteristics, whether a web camera is included or not, operating system availability, or a better video card. In this case, for a detailed comparison, a multidimensional perceptual map is used for a deeper assessment of the market, a comparison of competitors’ products, and our reflection on the client’s perception.
Thus, we can conclude that the two-dimensional perceptual map is used for less detailed analysis, while the multidimensional perceptual map is used for comprehensive analysis in a complex market.
How To Make A Perceptual Map
Creating a perfect and accurate perceptual map is a daunting task, but we love to challenge fate! We have done our best to make our manual as meaningful and suitable for real use as possible. Follow us into this world of diagrams and tasks!
Survey your customers
To get started, you need information. As much information as possible. From all angles, from all sides, and all sources. To analyze and find out what customers think about you, ask them. Implement after-sales service where customers can turn in case of problems. After the purchase, ask to rate the service and write a review about the product. If you don’t have one now, you can seek customer details and call or email them to rate the product. This will help you advance and understand who you are in the customers’ eyes.
Set a high standards
Having information from your customers about your brand at your fingertips, you can use it to your advantage, even if the feedback is negative. You can look at negative feedback from a positive side – now you will know how to do it even better. Look at your strengths and choose the attributes that best describe you.
Among the attributes may be:
- High-quality and low price
- Modern and stable
- Practical and vintage
- Convenience and dimensions
- Traditional and stylish
These attributes will be placed in opposite values to concentrate the focus and the customer’s view of your product.
Check out your competitors
Keep your friend close and your enemy even closer. Knowing your competitors is an advantage and it is much better than ignoring them. The minimum number of competitors for analysis is 12, but the more, the better. Just as you analyze your reputation and your image in the customer’s eyes, you should also analyze your competitors.
To analyze:
- Reviews of your competitors’ products
- Mentions of them in social networks, especially on TikTok and Twitter (X)
- Their current targeting and advertising
- Details about their products and services
- Their marketing strategy
- Their website design and SMM Instagram
- Competitors rating and market position
If it were not difficult, competitors must be evaluated consciously and ecologically. This will help you build the right connection between the real perception of competitors and yourself. The more information you have about your competitors, the more benefits you can get from it.
Create Perceptual Map
Once you have details about your brand and your competitors, you can create a perception map. But do not rush to draw up a map of yourself right away – start with your competitors. If you manufacture tennis rackets, to understand your position in the market, first add the position of your competitors. It will be better because, comparing ourselves with others, we have more space for analyzing ourselves. You will be able to go deeper into the internal kitchen of your brand and get to the table of a client who will come not to your competitor, but to you.
If you are a restaurant developing a new product and GTM strategy, you can do the following:
- Modify the perceptual map, replace quality and price with tastes and the level of environmental friendliness
- Look at other restaurants and compare indicators
- Find your golden mean and balance in environmental friendliness and taste
- Analyze GTM strategy for a new product from competitors
- Compare clients reactions
Putting your competitors first helps you understand that you are not alone in this field, and comparisons help you determine your exact position in customers’ perceptions.
Stakeholder communication
Sometimes during work, we get tired and can miss something important. For such cases, you should communicate with stakeholders and share with them the results of your work. \
Why communication with stakeholders is essential?
- Stakeholders can point out mistakes to you.
- If there are no matches for you with the perceptual map of your competitors, then stakeholders from the outside can see it.
- Your customer analysis is inaccurate and you need to change something to improve the credibility of the information.
- What was considered a minus, stakeholders consider as a plus.
- Your ad was out of date and you need to change its type.
After all, stakeholders can also tell you are on the right track and nothing needs to be changed. Feedback from trusted stakeholders is vital, so do not neglect it.
The Greatest Perceptual Map Examples
Perceptual Maps are created to solve real, not imaginary situations and cover any business. This provides you with a pumped-up strategy, awareness of your actions, and analysis of market positions and advantages over competitors. Here we have collected Perceptual Map Examples from many different fields so that you can start this strategy in action in various areas of business.
Example 1
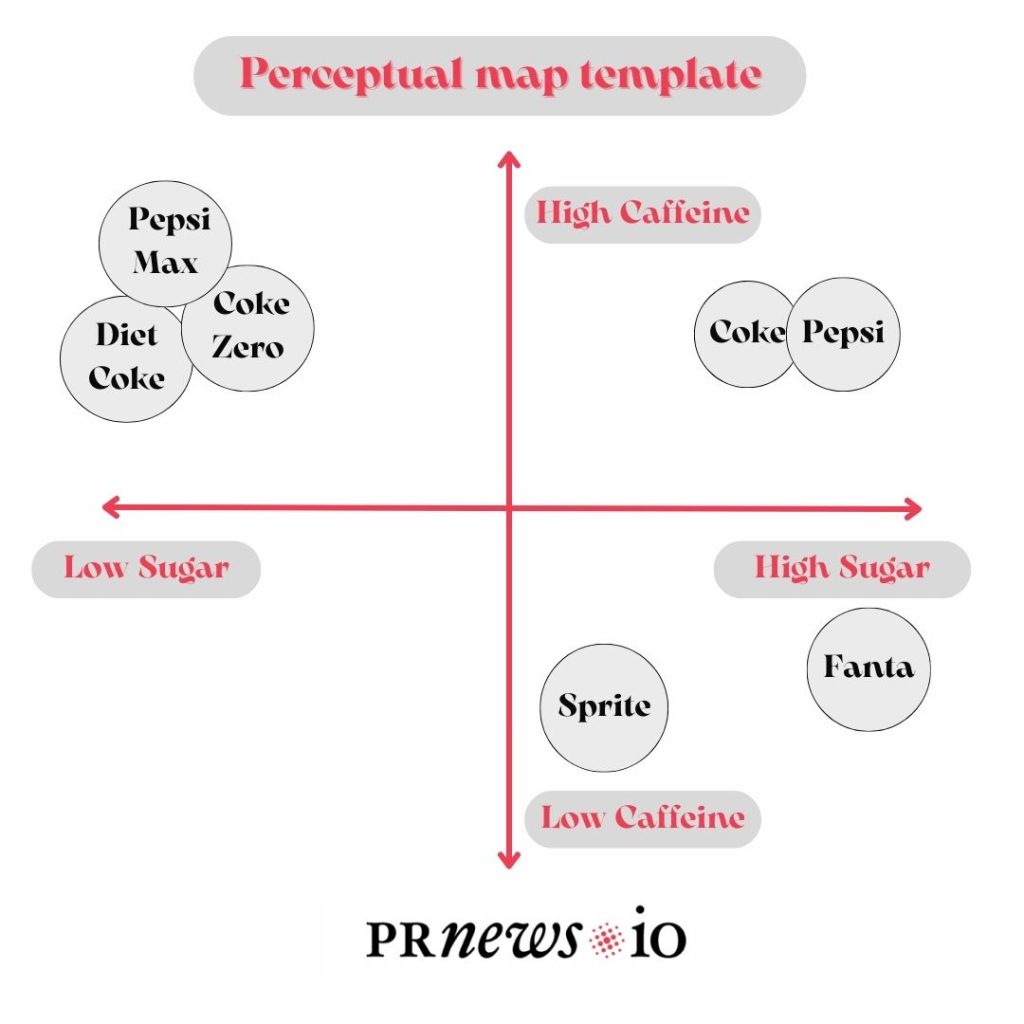
We all love sweet drinks, and Coca-Cola is the taste of childhood for most of us. Although the PepsiCo company also produces other soft drinks, the perceptual map allows you to evaluate the quality of Coca-Cola, Pepsi, Sprite, and Fanta based on many factors. For example, you can take the two variables Caffeine and Sugar.
Here our chart will be divided into low sugar – high caffeine – low caffeine – high sugar. According to this diagram, it is possible to determine which drinks consumers will choose based on the least amount of sugar and caffeine.
Example 2
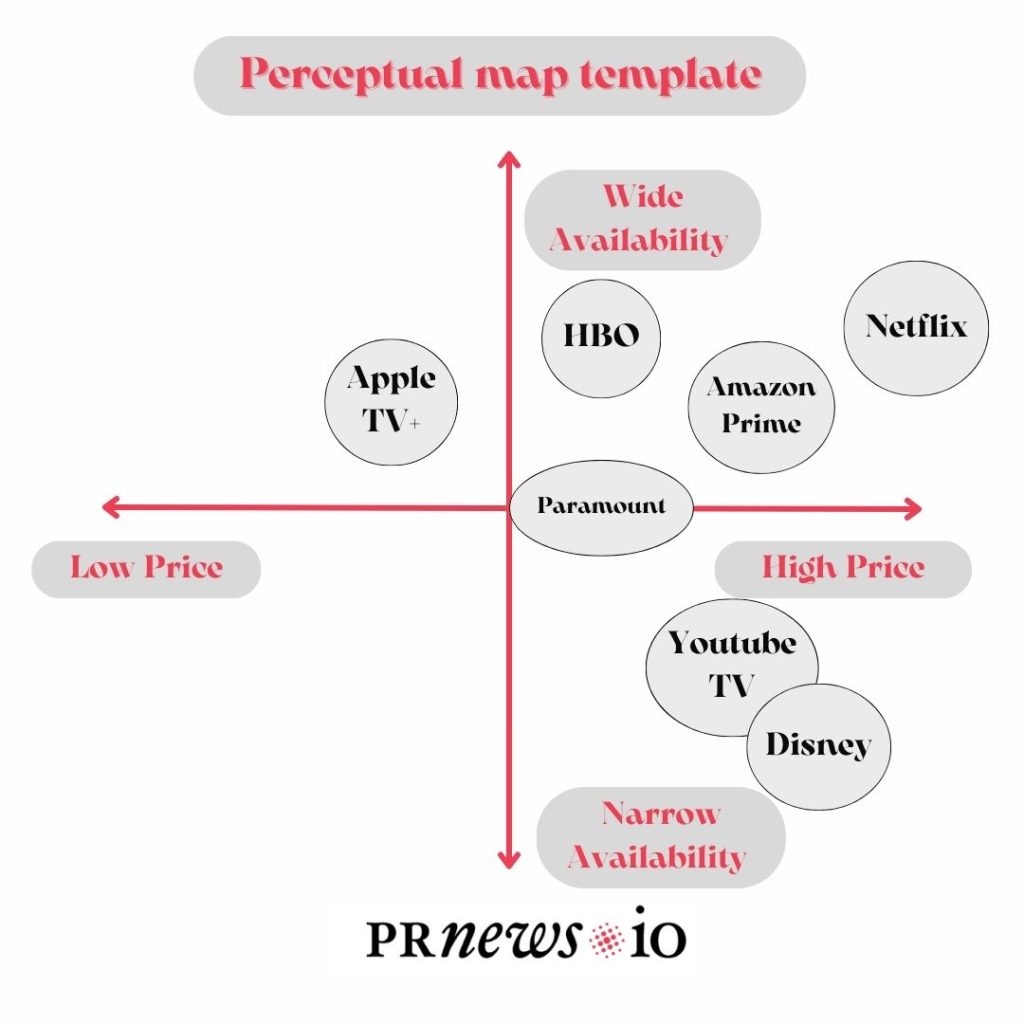
Every family uses streaming services like Netflix, Amazon Prime, Disney+ and more. When choosing the best place to buy a subscription, the client focuses on the ratio of price and availability and also depends on the viewer’s age – a child or an adult.
Thus, the diagram can be divided into low price – wide availability – narrow availability – high price. Another option: children – high quality – low quality – adult diagram.
Every streaming platform can see itself in these divisions and understand what it should improve to reach more viewers.
Example 3
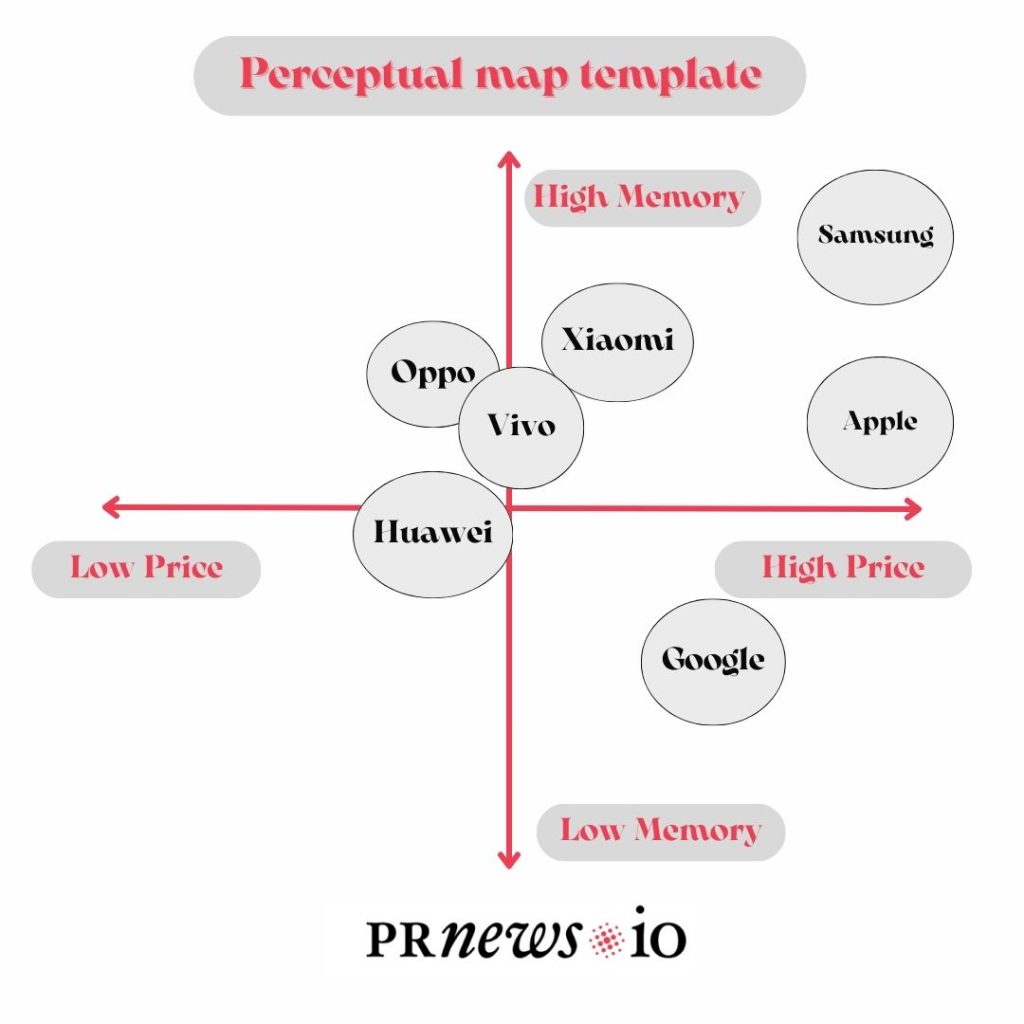
When buying a phone, the average person will look at such factors as the number of megapixels in the camera, how much built-in memory, NFC, 5G Internet, and of course the price. Here you can build an infinite number of diagrams, you can even try to build Multi-dimensional Perceptual Maps.
Example diagram: low memory – high price – low price – high memory. In this way, the manufacturer can determine exactly what kind of phone line people see and what can be changed for the better.
Example 4
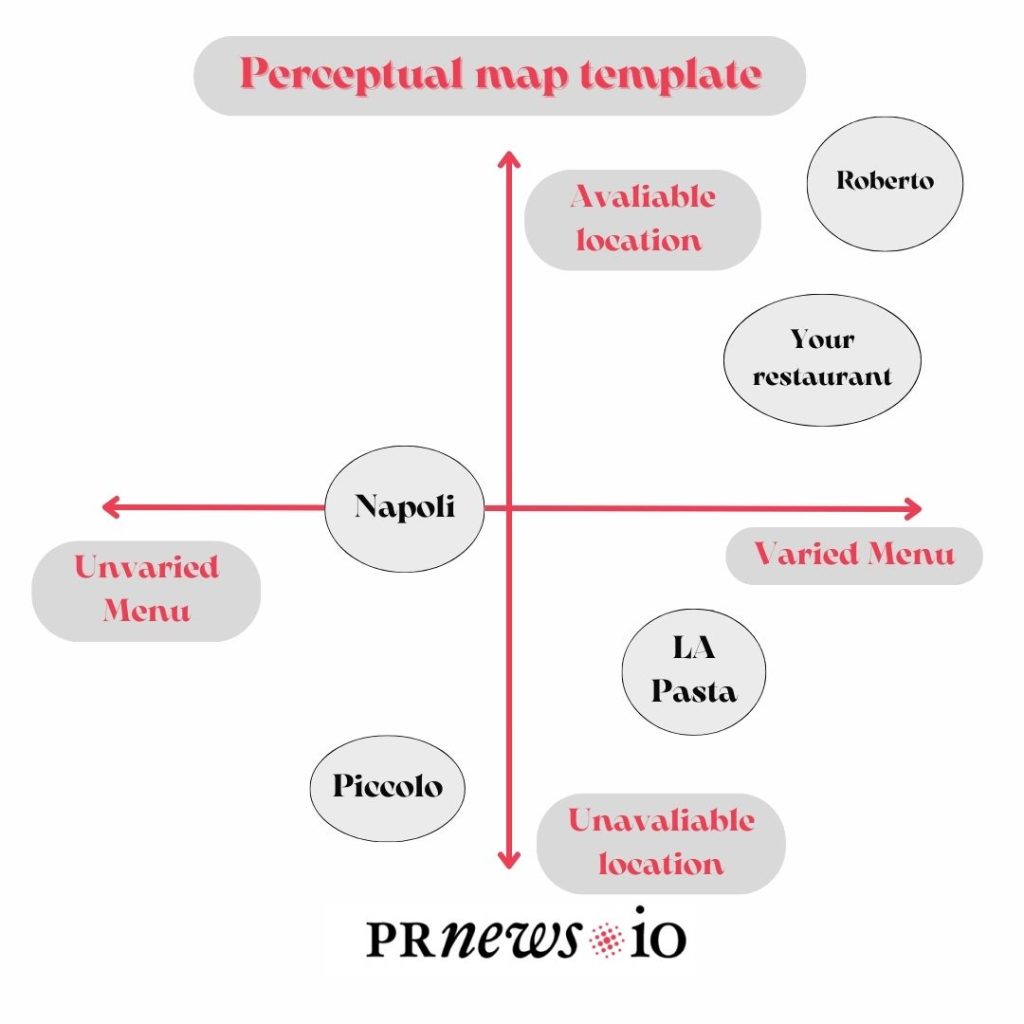
You are the owner of a restaurant business, namely an Italian restaurant in the city center. You want to understand where your competitors are and why visitors choose you.
You can make the following diagram: unvaried menu – available location – unavailable location – varied menu. If you get carried away, you can even divide the presence of pizza and pasta!
In this way, you will see the position of your restaurant in the eyes of visitors and restaurants of other competitors.
Example 5
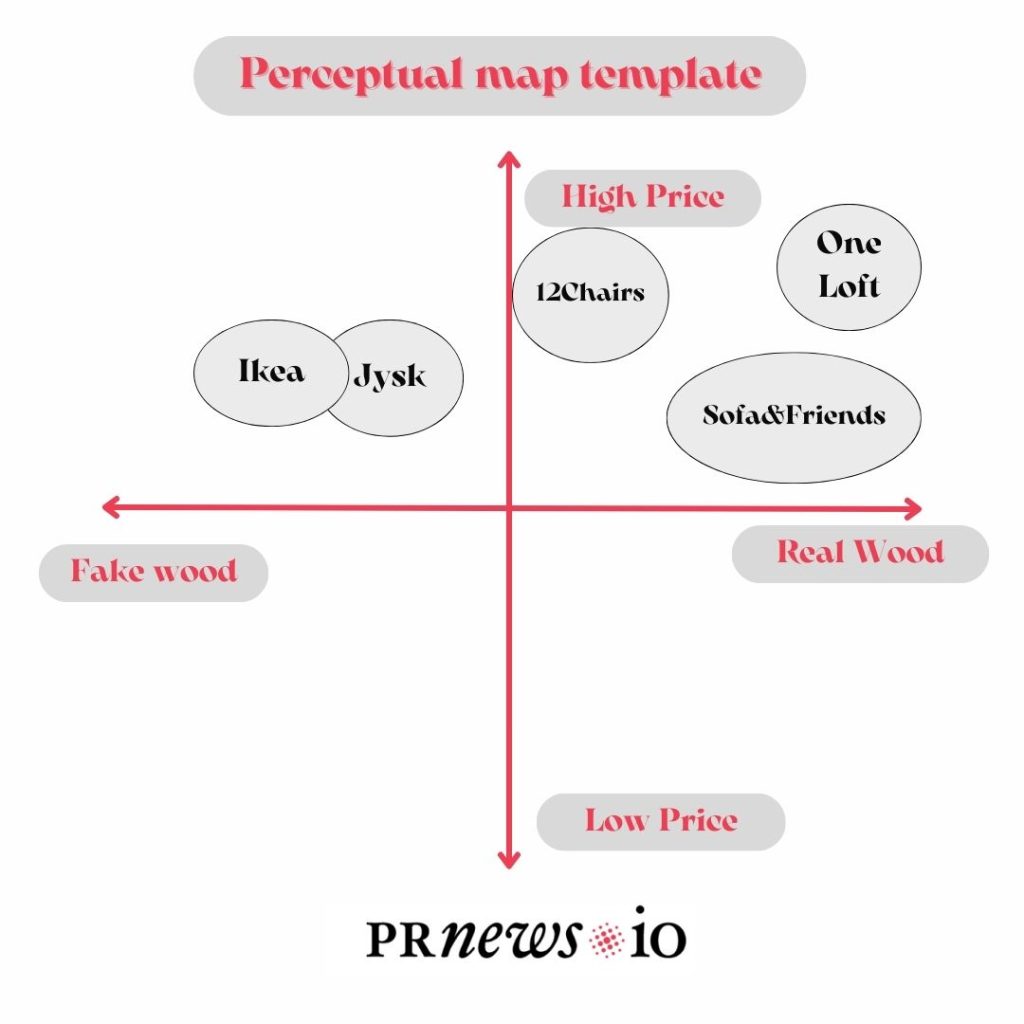
Furniture stores often compete with private carpenters. Both of them can earn a lot, but to see yourself in the eyes of buyers, you need to make a diagram. Large furniture stores, such as Jysk and Ikea, mainly sell non-natural wood, while private carpenters work exclusively with real wood.
The diagram can be made as follows: fake wood – high price – low price – real wood. Here you can see the dominance of private carpenters in everything, but furniture salons are also not far behind.
Free Perceptual Map Template
We have made it easy for you by creating a Perceptual Map Template. You can download it for free and modify it as you see fit. Use our features in creating your Perceptual Map for marketing and do not forget about all the points of this painstaking work. Go ahead!