A well-structured business framework is essential for optimising your product portfolio. The BCG matrix is a tool that helps to classify products based on market share and growth rate. This, in turn, guides decisions regarding investments, asset divestments, and product development with a view to optimizing the portfolio.
What is the BCG growth share matrix?
The Boston Consulting Group (BCG) Growth Share Matrix is a strategic planning tool developed by the Boston Consulting Group in 1970. It helps businesses determine which products or services to retain, which to invest more in, and which to discontinue.
BCG matrix axes
The matrix is displayed as a four-square diagram, where:
- The Y-axis shows market growth rates,
- The X-axis reflects relative market share.
The BCG Matrix, also known as the product portfolio matrix, is one of the most popular methods of portfolio analysis. It classifies a company’s products or services into four quadrants, depending on the level of market growth and market share. This determines their strategic position: low or high performance.
What are the core elements of the BCG matrix?
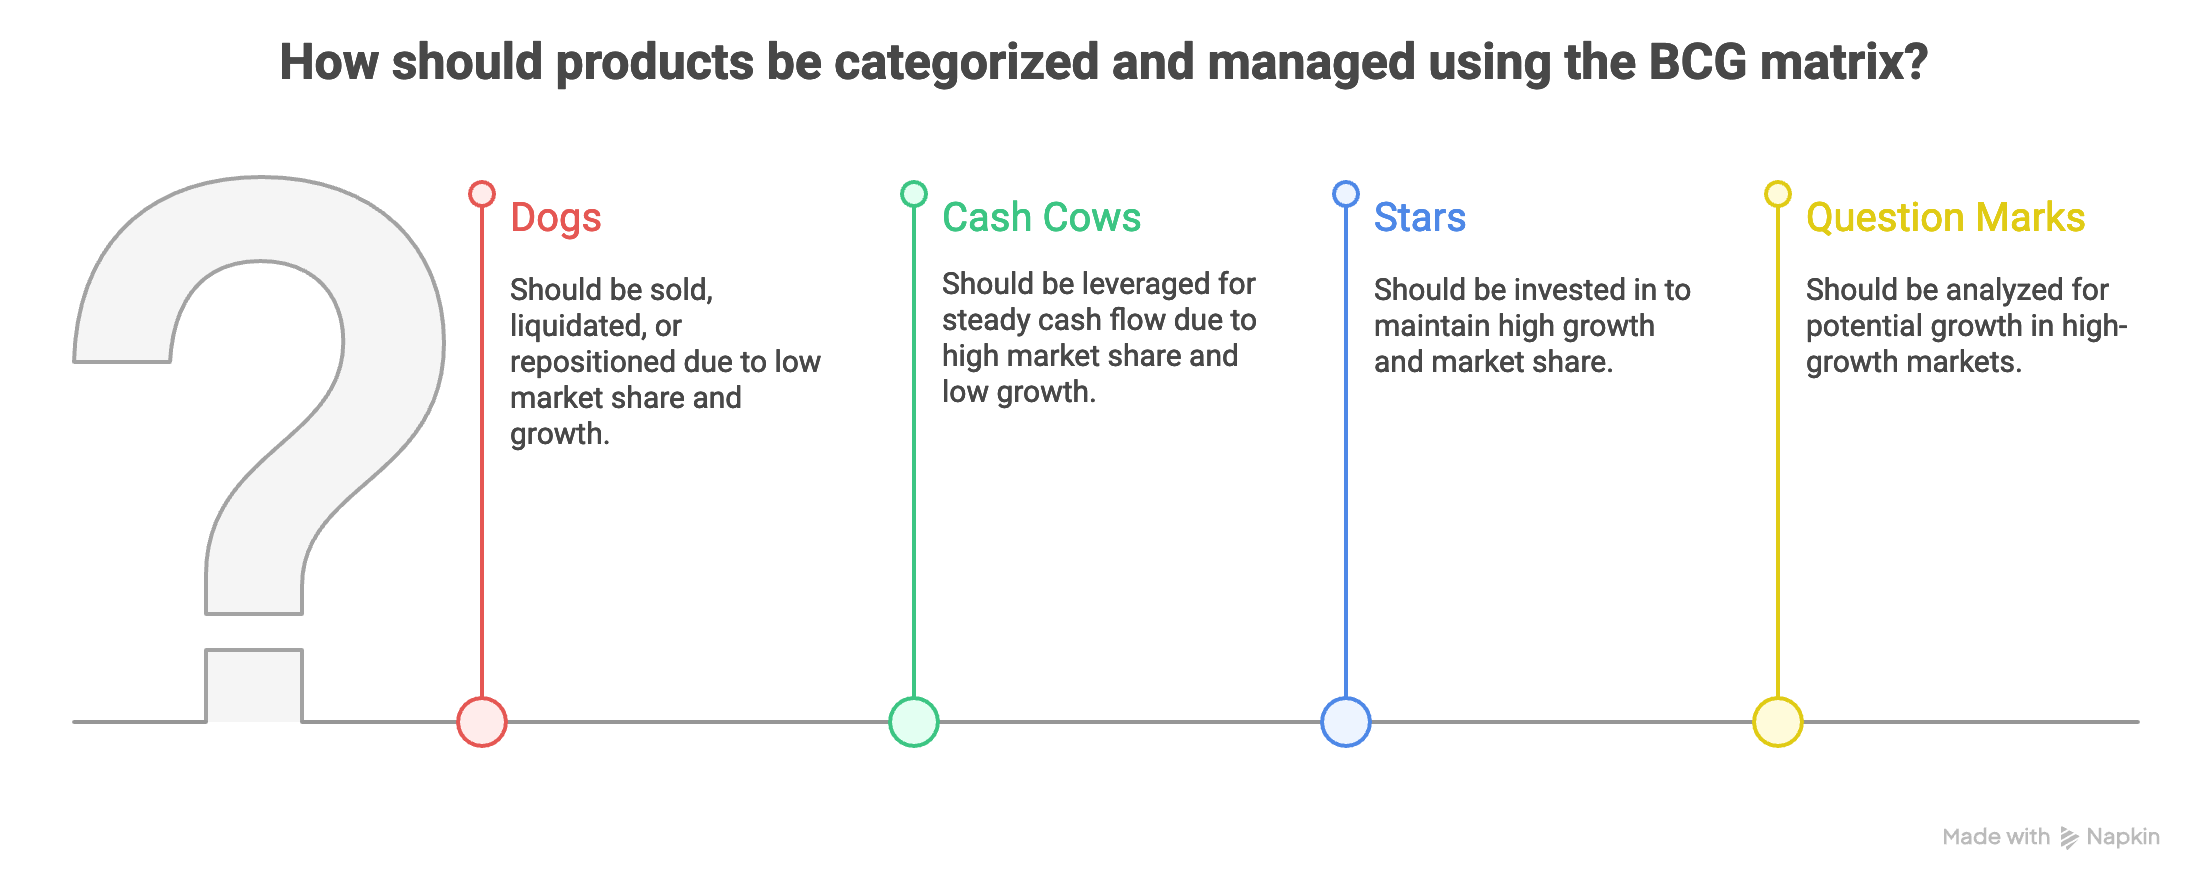
The BCG growth share matrix categorises products as either ‘dogs’, ‘cash cows’, ‘stars’, or ‘question marks’. Each quadrant has its own distinct features.
Element 1: Dogs (or pets)
Essentially, a product with a low market share and a low growth rate is referred to as a “dog”. Such products should be sold, liquidated, or repositioned for optimal use. ‘Dogs’ appear in the bottom right quadrant. Due to their low market share and growth, dogs generate little cash. They can tie up funds for long periods, making them ideal candidates for divestment.
Element 2: Cash cows
Merchandise with slow development but a large market presence is often referred to as “cash cows”. It is in a company’s best interest to leverage them for steady cash flow for as long as possible. Cash cows are usually found in the bottom left quadrant, typically in mature markets. These products frequently generate returns that exceed the market’s growth rate. They are self-sustaining from a cash flow perspective. You should take advantage of these products for as long as possible.
Element 3: Stars
Invest in “stars” – products in high-growth markets that hold significant market share. The top left quadrant is where the stars are located. They generate high income, but also consume large amounts of company cash. If they can remain market leaders, stars eventually become ‘cash cows’ when the market’s overall growth rate declines.
Element 4: Question marks
‘Question marks’ represent opportunities in high-growth markets where a company has a small market share. They appear in the top right-hand quadrant. Uncertainty is usually short-lived, but it uses up a lot of a business’s resources. Products in this quadrant should be analysed regularly and thoroughly to determine their viability.
Limitations of the BCG matrix
However, nothing in this world is perfect, including the BCG matrix. Let’s consider the main limitations:
- The matrix is a useful decision-making tool, but it does not take all business factors into account.
- Increasing market share may cost more than the potential additional sales revenue.
- Product development takes years, so careful planning is required, taking risks into account.
- The matrix classifies businesses only as “high” or “low,” ignoring medium-sized companies, which often account for a significant share of the market.
- Ignoring medium-sized companies can distort the real market situation.
- It is assumed that all business units operate independently of each other, which is not always true.
- Some “dogs” in the market may indirectly support other products or businesses, even if they themselves do not appear to be profitable.

When to use the BCG matrix?
Frankly speaking, the BCG matrix isn’t suitable for every case. The BCG Matrix can be used in the following situations:
- Maximising the potential of your range of products
The BCG Matrix is a useful tool for businesses with a diverse range of products or services. It helps you to evaluate and categorise them based on market share and growth rate, enabling you to make strategic decisions about investment, divestment, or development.
- Allocating your resources effectively
When resources are limited, and you need to prioritise where to allocate investment, the BCG Matrix provides a clear framework to identify which products require more investment (stars and question marks) and which products might need divestment (dogs).
- Identifying growth opportunities
The growth potential is identified by the BCG Matrix (stars and question marks), and steady profits (cash cows) that can fund further expansion are highlighted.
- Managing an extensive product portfolio
For businesses with multiple product lines, the BCG Matrix provides a straightforward method of evaluating the performance and potential of each product, ensuring that strategic decisions are based on a comprehensive understanding of market dynamics.
- Improving strategic planning
The BCG Matrix supports strategic planning by visually representing your product portfolio’s health and potential, guiding decisions on where to focus efforts for maximum impact.
BCG matrix example: Amazon
The growth matrix applies to many real-world companies, like Amazon. Let’s examine Amazon’s products by matrix category:
- Stars: AWS (cloud services) — rapid growth and market leadership.
- Cash Cows: Online retail (Amazon.com) — the main source of profit.
- Question Marks: Amazon Fresh (food, delivery) — a promising market, but competition is high.
- Dogs: Fire Phone — a failed product that has been discontinued.
In 2023, Amazon generated approximately $574.8 billion in net sales. This is significantly more than in previous years and indicates steady business growth.
The majority of Amazon’s revenue now comes from its services division. Amazon Web Services (AWS) is widely regarded as the company’s star performer, having generated approximately $90.8 billion in revenue in 2023 — a year-on-year increase of 13%. This makes AWS one of the fastest-growing and most profitable parts of Amazon’s business.
The company’s online retail operations remain its cash cow, bringing in the largest share of sales. In 2023, Amazon’s online stores generated $231.8 billion in sales, thanks to its dominant e-commerce platform. One area of uncertainty for Amazon is its physical stores, such as Whole Foods and Amazon Fresh. These generated just $18.9 billion in 2023, a relatively small figure compared to the rest of the company. The grocery and retail sector is highly competitive, with Walmart, Costco, and traditional supermarkets maintaining a strong presence.
A potential problem area for Amazon is its consumer devices segment, which includes Alexa-enabled devices and Kindles. Despite the fact that Amazon does not disclose precise sales figures for these products, reports suggest that there has been stagnation and even cost-cutting in Alexa development. This indicates slowing growth and profitability.
So, let’s summarize the revenue structure as follows:
- approximately 43.8% of sales were from goods (online and physical stores), amounting to approximately $252 billion;
- approximately 56.2% of revenue came from services (third-party seller platform, AWS cloud services, advertising, subscriptions, etc.), which is approximately $322 billion.

How to use the BCG matrix?
When attempting to use the BCG matrix for your organisation, consider following these steps:
Step 1: Select the product or business unit
First, you need to decide which aspect of your organisation to analyse using the BCG matrix. Some of the most common options are analysing the company as a whole, its strategic business units, specific product lines, or individual brands. The variables such as industry, market, competition, and position in the industry will vary depending on what you want to analyse.
For example, Nike may use the BCG Matrix to analyse not the entire organisation at once, but only its footwear portfolio. Within this area, the following can be assessed separately:
- Air Jordan (a brand with a high market share and high growth — ‘Star’),
- Nike Air Force 1 (a classic model with high profits but low growth — ‘Cash Cow’),
- new experimental running shoe models (small share but growing market — ‘Question Mark’),
- old unpopular models (low share and low growth — ‘Dogs’).
The PRNEWS.IO platform assists companies in this process by providing them with the opportunity to promote their products and services on world-renowned media platforms. This allows them to evaluate the effectiveness of various products and services, understand which ones generate stable income and which ones have high growth potential, and plan further investments accordingly.
Step 2: Specify the market or industry
Once you have decided what you want to analyse, you can identify the relevant market or industry. This step is crucial for creating an effective BCG matrix, since misclassifying a product line’s industry or market can lead to inaccurate results. For example, Tesla decides to analyse its business using the BCG matrix. At this stage, it needs to determine which market to use as a basis:
- If we analyse the entire automotive market, Tesla will have a relatively small share.
- If only the electric vehicle market is considered, Tesla’s share will be significantly larger, and the classification of its models (for example, Model 3 as a ‘Star’ and Model S as a ‘Cash Cow’) will be more accurate.
Step 3: Quantify the proportionate market share
Once you have selected the business or product line to analyse and clearly defined its market, you can determine its relative market share. You can base the calculation on either their revenue or their actual market share. To calculate this, you need to divide the revenue or market share of your chosen division by the revenue or market share of its largest competitor. The next step is to plot the relative market share on the x-axis.
Let’s say Samsung decides to analyse its smartphone division in the electronics market.
- Revenue from Samsung smartphone sales in a given year was $200 billion.
- Its biggest competitor, Apple (iPhone), earned $240 billion in the same market.
To determine the relative market share, we divide:
Relative market share=240/200=0.83
This means that Samsung has 83% of its biggest competitor’s market share, and this value should be plotted on the X-axis in the BCG matrix.
Step 4: Estimate the market growth rate
Relatively widespread markets and industries will likely have reports available that detail their growth rates. Alternatively, you can estimate future growth rates by analysing the average revenue growth of your largest competitors. Note that market growth rates are expressed as a percentage and plotted on the Y-axis.
For example, Amazon analyses its AWS (Amazon Web Services) division. To determine the market growth rate:
- According to Gartner, the Infrastructure as a Service (IaaS) market grew by 22.5% in 2024, reaching a volume of $171.8 billion.
- The global transition to cloud solutions and high demand are driving this growth, allowing us to consider 22.5% as the approximate annual growth rate in this segment, which should be reflected on the Y-axis in the BCG matrix.

Step 5: Mark the circles on the matrix
Once you have calculated all the relevant metrics for each business unit or product line, you can plot them in a matrix. Do this by circling each business or product in the matrix. The size of each circle is proportional to the revenue generated by each business or product.
For example, Coca-Cola is building a BCG matrix for its beverage portfolio in 2023:
- Coca-Cola Classic
- Relative market share: 1.2 (compared to its biggest competitor, Pepsi)
- Market growth rate: 2%
- Revenue: $40 billion
- Marked with a large circle in the ‘Cash Cow’ quadrant due to stable but low growth rates.
- Coca‑Cola Zero Sugar
- Relative market share: 1.0
- Market growth rate: 8%
- Revenue: $15 billion
- Circle in the ‘Star’ quadrant, because the product is growing rapidly and has a strong market share.
- Honest Tea
- Relative market share: 0.2
- Market growth rate: 10%
- Revenue: $1.5 billion
- A small circle in the ‘Question Mark’ quadrant, the product is promising, but its market share is small.
- Some old juice brands
- Relative market share: 0.1
- Market growth rate: 1%
- Revenue: $0.5 billion
- A small circle in the ‘Dogs’ quadrant, a weak product with low growth and a small market share.
The PRNEWS.IO platform can help visualise products that are actively promoted on international media platforms. Thanks to visibility analytics, you can assess which products generate the most revenue or have growth potential and display this as the size of a circle on a matrix.
To sum up
The BCG growth share matrix is a strategic tool. It is used by management to evaluate and prioritise a company’s product lines. It uses a 2×2 matrix. This measures market growth against market share. Despite being widely taught in business schools, the matrix has limitations, such as failing to account for market dynamics or interdependencies among companies.